# Loading libraries:
suppressMessages({
    library(ALDEx2)
    library(data.table)
    library(dplyr)
    library(IRdisplay)
    library(KEGGREST)
    library(MGnifyR)
    library(pathview)
    library(tidyjson)
    library(IRdisplay)
})
source("lib/variable_utils.r")
source("lib/kegg_pathways_utils.r")

# display_markdown(file = '../_resources/mgnifyr_help.md')Pathways Visualization
R
Visualization
An expertly curated notebook to generate pathway visualizations from MGnify data, to which I actively contributed.
Pathways Visualization
In this notebook we aim to demonstrate how the MGnifyR tool can be used to fetch functional annotation results generated through the MGnify metagenomic analyisis pipelines. Then we show how to generate the pathways visualization using Pathview in R.
MGnifyR is a library that provides a set of tools for easily accessing and processing MGnify data in R, making queries to MGnify databases through the MGnify API. The benefit of MGnifyR is that data can either be fetched in tsv format or be directly combined in a phyloseq object to run an analysis in a custom workflow.
This is an interactive code notebook (a Jupyter Notebook). To run this code, click into each cell and press the ▶ button in the top toolbar, or press shift+enter
Contents
# Create your session mgnify_client object
mg = mgnify_client(usecache = T, cache_dir = '/home/jovyan/.mgnify_cache')
# Setting tables and figures size to display (these will be reset later):
options(repr.matrix.max.cols=150, repr.matrix.max.rows=500)
options(repr.plot.width=2, repr.plot.height=2)Drawing presence/absence KOs for one metagenomic sample
1.1. Fetching data from MGnify & Pathways Selection
PATHWAY_STUDY_IDS <- get_variable_from_link_or_input('PATHWAY_STUDY_IDS', name =  'Study Accession', default = 'MGYS00006180,MGYS00006178')
PATHWAY_STUDY_IDS <- c(strsplit(PATHWAY_STUDY_IDS, ",")[[1]])
print(paste("Using", PATHWAY_STUDY_IDS, "as Study Accession"))
Type a Study Accession [default: MGYS00006180,MGYS00006178] [1] "Using MGYS00006180 as Study Accession"
[2] "Using MGYS00006178 as Study Accession"
- Both the studies chosen by Alejandra Escobar are related to the gut bacteria of honeybees.
# Custom Pathways Selection

# Most general pathways include
# Glycolysis / Gluconeogenesis, Citrate cycle (TCA cycle), Pentose phosphate pathway,
# Fatty acid biosynthesis, Pyrimidine metabolism, Oxidative phosphorylation

CUSTOM_PATHWAY_IDS <- PathwaysSelection()
Pathways Selection :
For the most general & most complete pathways, input ‘G’
Press Enter to generate the most complete pathways
To add custom pathways, input pathway numbers (ex: 00053,01220)
Type a Pathways Accession [default: ] G
Using 00010  -  Glycolysis / Gluconeogenesis  :  https://www.kegg.jp/pathway/map00010 as a Custom Pathway
Using 00020  -  Citrate cycle (TCA cycle)  :  https://www.kegg.jp/pathway/map00020 as a Custom Pathway
Using 00030  -  Pentose phosphate pathway  :  https://www.kegg.jp/pathway/map00030 as a Custom Pathway
Using 00061  -  Fatty acid biosynthesis  :  https://www.kegg.jp/pathway/map00061 as a Custom Pathway
Using 01232  -  Nucleotide metabolism  :  https://www.kegg.jp/pathway/map01232 as a Custom Pathway
Using 00240  -  Pyrimidine metabolism  :  https://www.kegg.jp/pathway/map00240 as a Custom Pathway
Using 00190  -  Oxidative phosphorylation  :  https://www.kegg.jp/pathway/map00190 as a Custom Pathway
- Fetching the analysis accession list using the study accessions.
output <- capture.output({
  all_accessions <- mgnify_analyses_from_studies(mg, PATHWAY_STUDY_IDS)
  all_metadata <- mgnify_get_analyses_metadata(mg, all_accessions)
})- Keeping just the first analysis accession to fetch the kegg orthologs count table from the MGnify API and transform from JSON to matrix.
accession = head(all_accessions, 1)
ko_loc = paste0('analyses/',accession,'/kegg-orthologs')
ko_json = mgnify_retrieve_json(mg, path = ko_loc)
ko_data = as.data.frame(ko_json %>% spread_all)[ , c("attributes.accession", "attributes.count")]
ko_data = data.frame(ko_data, row.names=1)
colnames(ko_data)[1] = 'counts'
ko_matrix = data.matrix(ko_data)
head(ko_matrix, 3)| counts | |
|---|---|
| K10822 | 115 |
| K02030 | 91 |
| K02004 | 79 |
- Fetch the modules completeness table and filter out completeness < 100%.
comp_loc = paste0('analyses/',accession,'/kegg-modules')
ko_comp_json = mgnify_retrieve_json(mg, path = comp_loc)
ko_comp = as.data.frame(ko_comp_json %>% spread_all)
modules = ko_comp[ko_comp$attributes.completeness == 100,][, c("attributes.accession")]
head(modules)- 'M00001'
- 'M00002'
- 'M00003'
- 'M00004'
- 'M00005'
- 'M00006'
1.2. Selecting the most complete pathways
# Setting up function that collects KEGG pathways for a given list of IDs, excluding chemical structure & global maps

collect_pathways <- function(ids_list) {
    pathways = list()
    for (id in ids_list) {
        current_pathway = as.list(keggLink("pathway", id))
        for (index in grep("map", current_pathway)) {
            clean_id = gsub("*path:", "", current_pathway[index])
            # Discarding chemical structure (map010XX), global (map011XX), and overview (map012XX) maps
            prefix = substring(clean_id, 1, 6)
            if(is.na(match("map010", prefix)) & is.na(match("map011", prefix)) & is.na(match("map012", prefix)) ){
                pathways = append(pathways, clean_id)
            }
        }
    }
    return(pathways)
}
- Now we need to collect the list of template pathways where these complete modules can be draw. This step takes less than 1 minute to run.
md_pathways = collect_pathways(modules)
head(md_pathways)- 'map00010'
- 'map00010'
- 'map00010'
- 'map00020'
- 'map00030'
- 'map00030'
- In order to draw the most complete pathways maps, we will use the list of templates we obtained in the previous step and select only pathways having all their constituent modules.
# Counting the number of modules we have in each pathway
our_pathways_counts = list()
for (path_element in md_pathways) {
    if (path_element %in% names(our_pathways_counts)) {
        new_value = our_pathways_counts[[path_element]] + 1
        our_pathways_counts[path_element] = new_value
    } else {
        our_pathways_counts[path_element] = 1
    }
}

# Counting the number of modules expected in each pathway
u_pathways = unique(md_pathways)
exp_pathways_counts = list()
for (path in u_pathways) {
    mod_count = length(as.list(keggLink("module", path)))
    exp_pathways_counts[path] = mod_count
}

# Selecting the pathways having all their constituent modules. We remove the 'map' prefix as pathview doesn't like it
to_draw = list()
for (pathway in names(our_pathways_counts)) {
    our_value = our_pathways_counts[[pathway]]
    exp_value = exp_pathways_counts[[pathway]]
    ratio =  our_value / exp_value
    if (ratio == 1) {
        nude_id =  gsub("map", "", pathway)
        to_draw = append(to_draw, nude_id)
    }
}


# Adding the custom pathways to to_draw if not present already
for (pathway in CUSTOM_PATHWAY_IDS){
    if (!(pathway %in% to_draw)) {
    to_draw = append(to_draw, pathway)
        }
    }
# printing name of the pathways to be drawn
for (pathway in to_draw){
display_markdown(paste(pathway, "--> ", get_pathway_info(pathway)[1]," : ",get_pathway_info(pathway)[2], sep=" "))
}00010 –> Glycolysis / Gluconeogenesis : https://www.kegg.jp/pathway/map00010
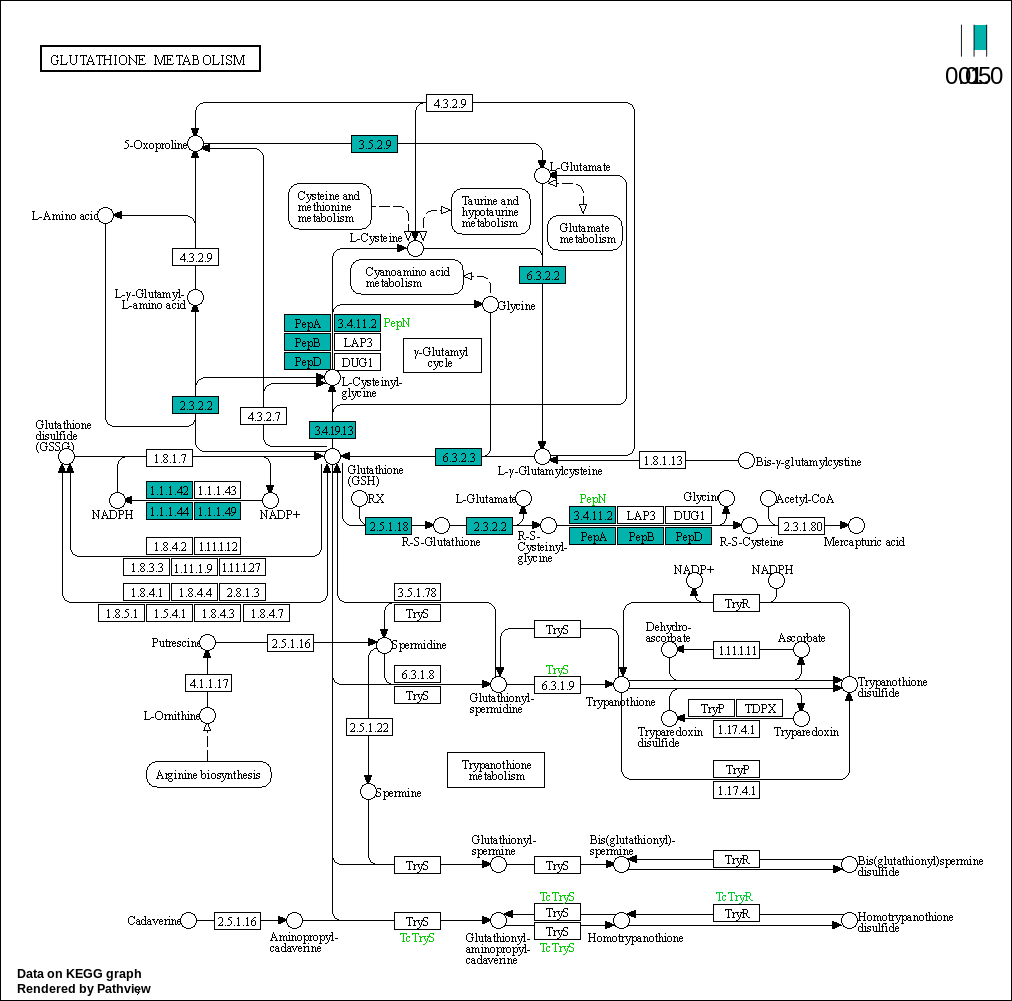
00480 –> Glutathione metabolism : https://www.kegg.jp/pathway/map00480
00430 –> Taurine and hypotaurine metabolism : https://www.kegg.jp/pathway/map00430
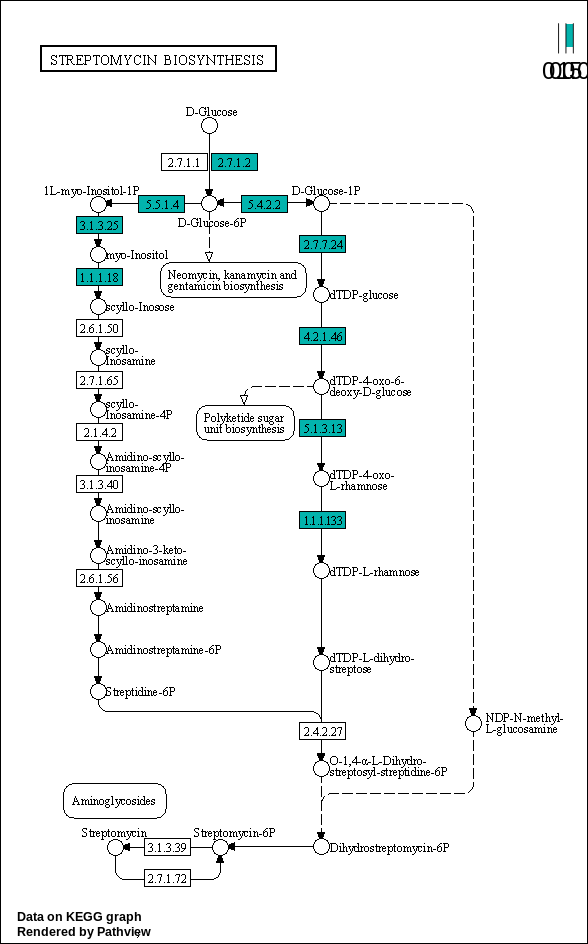
00521 –> Streptomycin biosynthesis : https://www.kegg.jp/pathway/map00521
00020 –> Citrate cycle (TCA cycle) : https://www.kegg.jp/pathway/map00020
00030 –> Pentose phosphate pathway : https://www.kegg.jp/pathway/map00030
00061 –> Fatty acid biosynthesis : https://www.kegg.jp/pathway/map00061
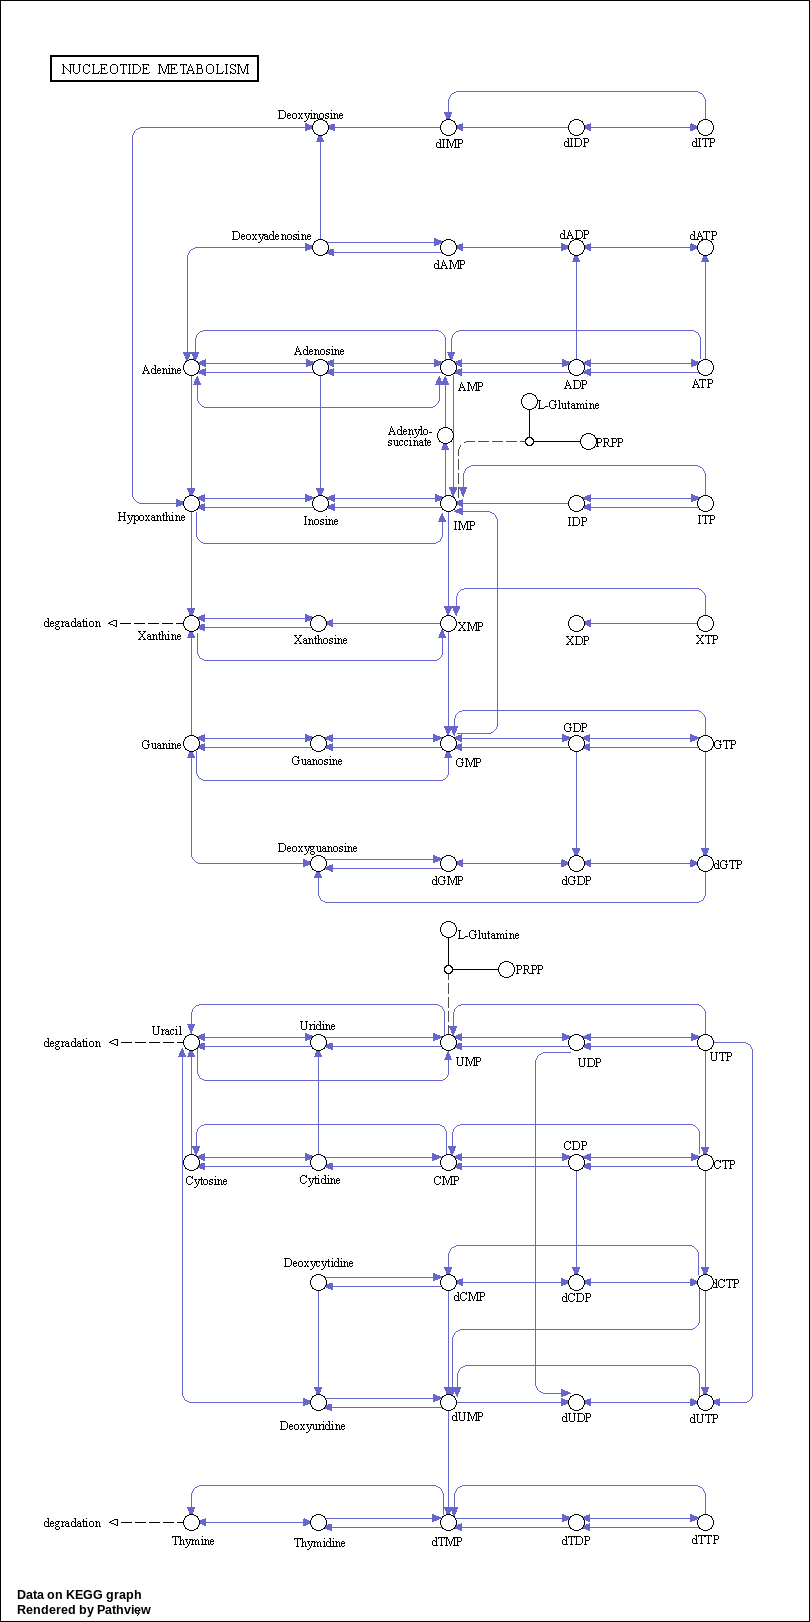
01232 –> Nucleotide metabolism : https://www.kegg.jp/pathway/map01232
00240 –> Pyrimidine metabolism : https://www.kegg.jp/pathway/map00240
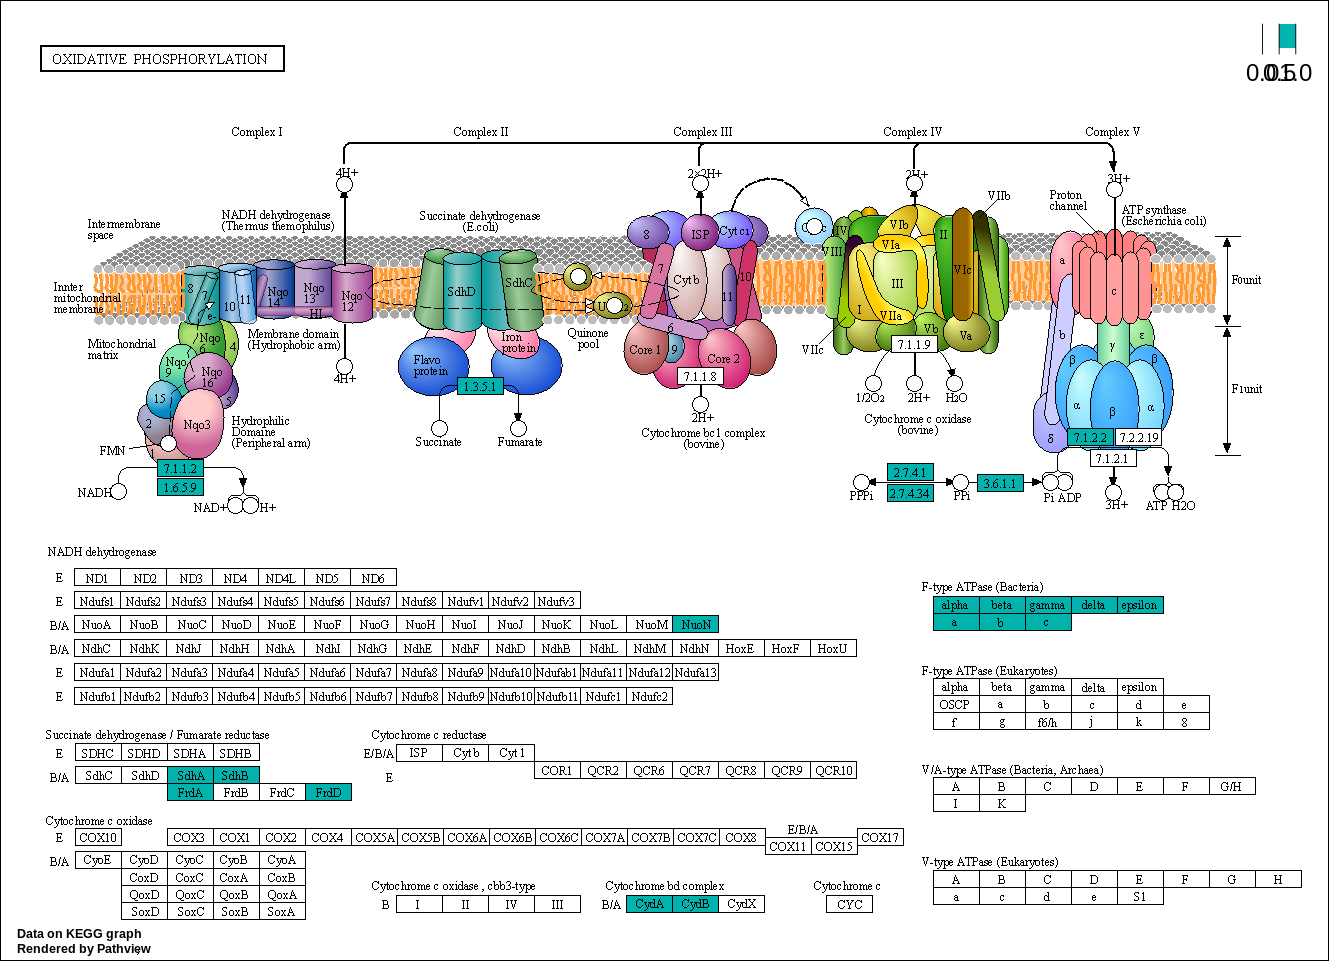
00190 –> Oxidative phosphorylation : https://www.kegg.jp/pathway/map00190
1.3. Ready to draw!
- As we are plotting absence/presence, we set the number of bins = 2, the scale in one direction, and use 1 as limit.
Takes a couple of minutes depending on the number of pathways
- Clearing the current working directory and Displaying all the generated figures that are stored at the
pathway_plots/directory.
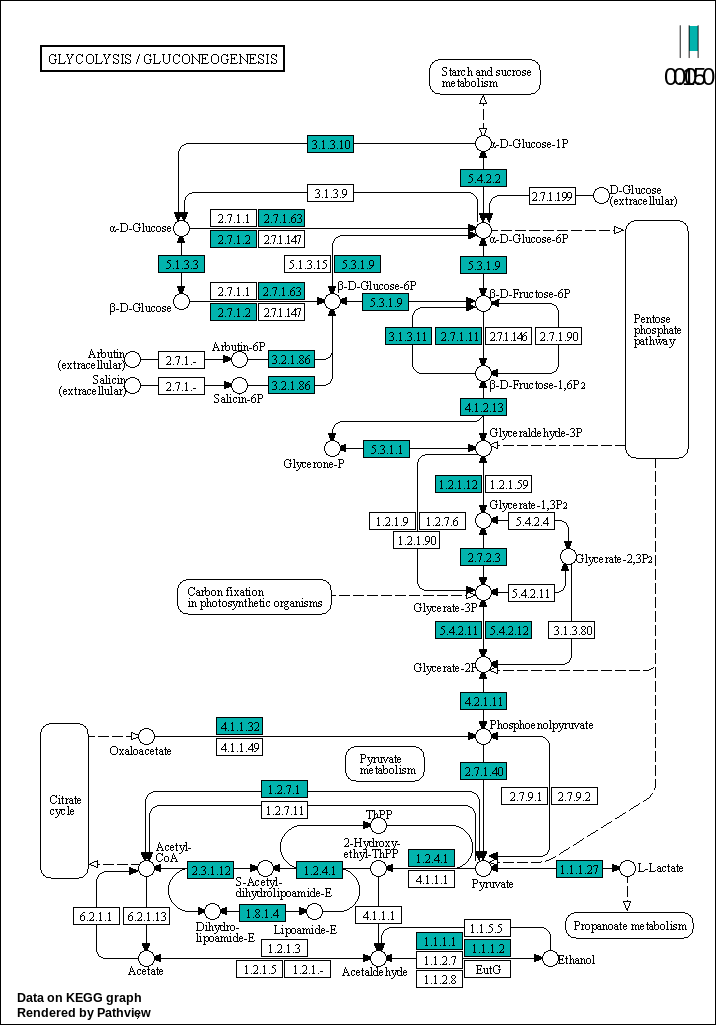
generatePathwayPlots()Glycolysis / Gluconeogenesis
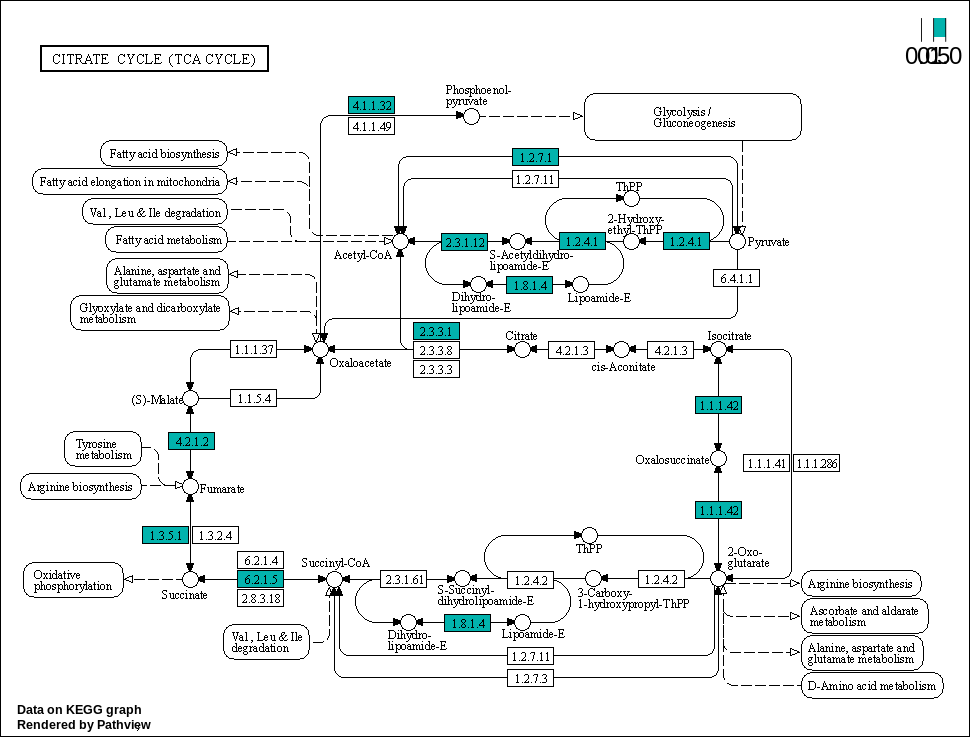
Citrate cycle (TCA cycle)
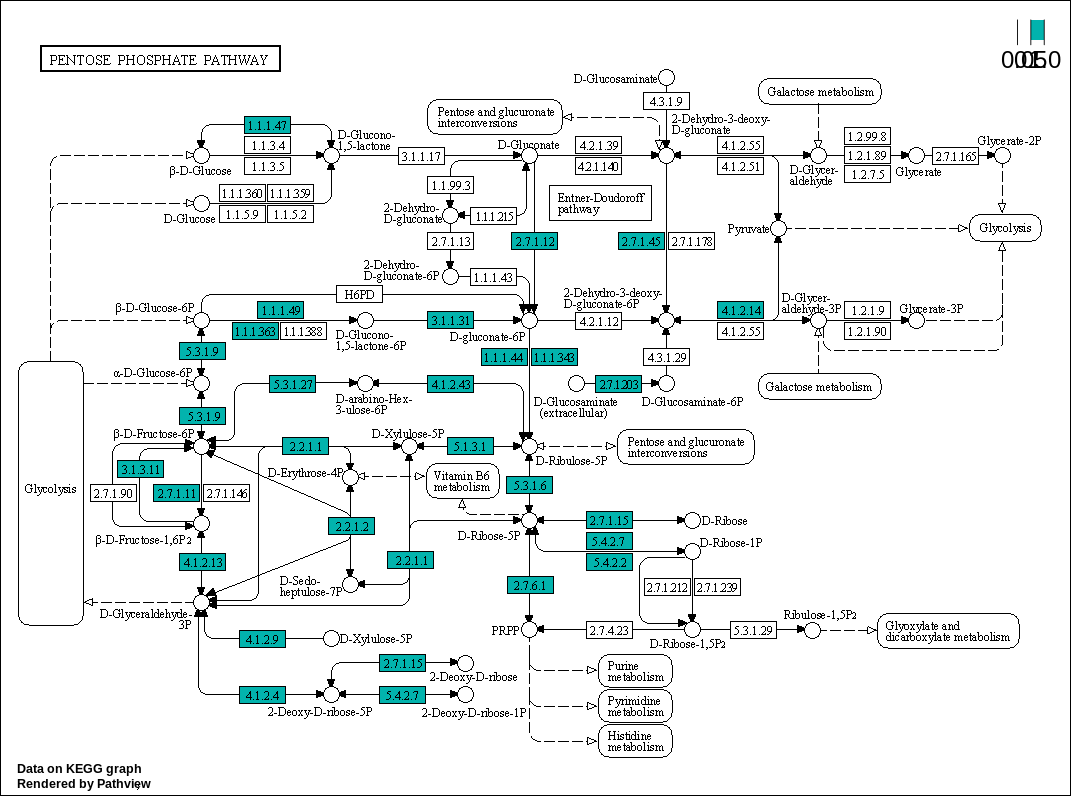
Pentose phosphate pathway
Fatty acid biosynthesis

Oxidative phosphorylation
Pyrimidine metabolism

Taurine and hypotaurine metabolism

Glutathione metabolism
Streptomycin biosynthesis
Nucleotide metabolism
Resources and Documentation
MGnify
- https://docs.mgnify.org/src/docs/analysis.html#assembly-analysis-pipeline - Description of the latest MGnify analysis pipeline and the tools it uses.
- https://academic.oup.com/nar/article/48/D1/D570/5614179 - This paper highlights the platform’s functionalities for metagenomic data assembly and analysis. It also describes he implementation of KEGG modules in MGnify.
Pathview
- The official documentation for Pathview, a tool for pathway-based data integration and visualization. It provides an overview of the tool and explains how to use it effectively.
- You can find more information at https://pathview.uncc.edu/overview#kegg_view .
KEGGREST
- KEGGREST is a Bioconductor package that provides programmatic access to the KEGG database.
- More about KEGGREST at http://www.bioconductor.org/packages/release/bioc/vignettes/KEGGREST/inst/doc/KEGGREST-vignette.html .